7950 Legacy Drive, Suite 400, Plano, TX 75024
  469-375-9656
  info@planowebsitedesign.com







TL;DR
The three Core Web Vitals are Largest Contentful Paint, Interaction to Next Paint, and Cumulative Layout Shift. The “good” thresholds published on web.dev are LCP of 2.5 seconds or less, INP of 200 milliseconds or less, and CLS of 0.1 or less, measured at the 75th percentile of page loads and segmented across mobile and desktop. Those thresholds are scored against field data from real Chrome users over a rolling 28-day window, not against the coloured number a speed test hands you. Plenty of small business sites never generate enough traffic to appear in that dataset at all. Google treats page experience as one input among many and says relevance still wins when a competing page is more helpful.
Table of Contents
What Google Actually Times While Your Page Loads
Each of the three metrics watches a different part of the same few seconds. One times the arrival of content, one times the response to a tap, and the third times how much the page moves under a reader’s thumb while they are trying to read it.
Largest Contentful Paint records when the largest image or text block in the viewport finishes rendering. web.LCP reference counts <img> elements, images inside <svg>, <video> elements, elements carrying a CSS background image, and block-level elements containing text. On a typical Plano service site, that element is the hero photo, or the headline sitting on top of it.
Interaction to Next Paint is the newer one, and the one most owners have never heard of. It joined the set as a stable metric in 2024, replacing First Input Delay. Per the same site’s INP reference, it watches clicks, taps, and key presses, then reports roughly the worst interaction across the entire visit. Scrolling and hovering do not count.
Cumulative Layout Shift is the score for content moving when nobody asked it to.
Each shift is calculated as impact fraction multiplied by distance fraction, and the page’s CLS is the largest burst of shifts inside a session window: a run of shifts less than a second apart, capped at five seconds total, per web. Dev’s CLS reference. That definition matters more than it sounds. A page can shift ten times over its life and still score well if no single burst is severe, and a page can shift exactly once, badly, at the moment someone reaches for a button, and score terribly.
| Metric | What it times | Good | Needs improvement | Poor |
| Largest Contentful Paint (LCP) | Time until the biggest visible element finishes rendering | 2.5 seconds or less | 2.5 to 4.0 seconds | over 4.0 seconds |
| Interaction to Next Paint (INP) | Delay between a tap or click and the next painted frame | 200 milliseconds or less | 201 to 500 milliseconds | over 500 milliseconds |
| Cumulative Layout Shift (CLS) | Unexpected movement of content during the page’s life | 0.1 or less | 0.1 to 0.25 | over 0.25 |
Thresholds from the same web. Dev overview, matched against the Core Web Vitals report documentation Google publishes on support.google.com. Two of the three are stated in units of time. CLS is a unitless ratio, which is why 0.31 sounds harmless and is, in fact, a page that reshuffles itself under the reader.
Why Does the Score Change Every Time You Run the Test?
Because the number in the coloured circle is a lab simulation, and simulations vary. Google’s Lighthouse performance scoring documentation on developer.chrome.com lists the causes: different devices, browser extensions injecting scripts, antivirus software, changes in ad serving, and internet routing. It goes further and suggests it may be more useful to think of your site performance as a distribution of scores rather than a single number.
That number is also not your Core Web Vitals assessment. It is a weighted average of lab metrics, and its heaviest single input is Total Blocking Time, which is not one of the three Core Web Vitals. Score bands run 0 to 49 red, 50 to 89 orange, 90 to 100 green, and the same page notes that a perfect 100 is extremely challenging and not expected.
A red circle tells you something is slow in a simulated load on a throttled mid-range phone. Useful. Not what the ranking systems are looking at.
The thing they look at sits higher up the same report. Lab data, per web.dev’s comparison of the two, is “determined by loading a web page in a controlled environment with a predefined set of network and device conditions”, while field data is “determined by monitoring all users who visit a page and measuring a given set of performance metrics for each one of those users’ individual experiences”. The advice attached to that distinction is one sentence long: if you have both, field data is what you should use to prioritise.
Two consequences follow, and both matter more than the score itself. Your field numbers lag any fix you make by up to four weeks. And your field numbers can be green while your lab score is orange, or the reverse, without either being wrong.
Most Small Plano Sites Have No Field Data at All
Here is the part almost nobody gets told. If your site does not carry enough Chrome traffic, it never enters the Chrome User Experience Report, and there is no Core Web Vitals assessment for it to pass or fail.
The CrUX methodology page on developer.chrome.com sets two conditions for a page or origin to appear. It has to be publicly discoverable, meaning indexed, returning proper status codes, and free of a noindex tag. It also has to be sufficiently popular, with a minimum number of visitors needed to build a reliable sample. That visitor threshold is deliberately undisclosed. Anyone quoting you a precise figure for it is guessing.
There is a second filter, on the visitor side.
Only Chrome users who have enabled usage statistics reporting, are syncing their browser history, and have no sync passphrase set contribute data at all. A slice of your real traffic, in other words, and on a small site that slice gets thin enough to disappear.
For a single-location contractor in Allen or a boutique off 15th Street in downtown Plano, the practical result is a report showing a lab score above an empty field-data panel. Search Console behaves the same way. Its Core Web Vitals report groups URLs by similar experience, and when a group holds too little data, the support.google.com documentation says Search Console rolls it up into an origin-level group covering everything on the host, or shows nothing at all.
None of that makes the speed work pointless. A slow page is slow for the person standing on it whether or not Chrome ever told Google. What it does mean is that chasing a green assessment on a site with 400 monthly visitors is chasing something that does not exist yet, and the honest goal for that site is a faster page and more traffic, in that order.
How Much Does Any of This Move Your Ranking?
Less than most articles on this subject imply. The page experience documentation says core ranking systems “look to reward content that provides a good page experience” and recommends achieving good Core Web Vitals for success in Search. Then comes the sentence the rest of the internet skips: “Google Search always seeks to show the most relevant content, even if the page experience is subpar.”
Read those together, and you get a tiebreaker, not a lever. Where several pages answer a query about equally well, page experience can be part of what separates them. Where one page answers the question, and yours does not, no amount of speed work closes that gap.
We tell clients this constantly, and it belongs here too: nobody, us included, can promise you that fixing LCP moves you from position eight to position three. Google’s own guidance on third-party SEO advice, on the same Search Central site, explains why in two sentences. Outside tools “don’t have access to our internal ranking data. They can’t guarantee performance.”
What speed does reliably protect the traffic you already earn? A visitor who bounced off a page that had painted nothing yet was a ranking you paid for and did not convert.
Where Each Metric Usually Breaks on a Local Business Site
Across small business builds, the same handful of causes account for most failures. The pattern repeats often enough that you can usually name the culprit before opening the report.
What drags largest contentful paint
Hero images are the repeat offenders. An uncompressed 3,000-pixel-wide photograph served to a phone screen, a slider carrying four of them, or a background image referenced in CSS that the browser cannot find until the stylesheet parses. Server response time compounds all of it, since LCP includes connection setup, redirect time, and other Time To First Byte delays, so shared hosting and a redirect chain both land inside the metric. Render-blocking fonts then keep the headline invisible even after the image is ready.
What drags interaction to next paint
Script weight, almost always. A chat widget, a booking embed, heat mapping, three separate analytics tags, and a consent banner all bind event handlers to the same main thread, and INP measures the whole trip: input delay before handlers run, processing duration while they execute, and presentation delay until the frame paints. Somebody tapping your phone number on a phone waits behind every one of those. The fix is usually removal rather than tuning, because the fourth tracking script is rarely earning its seat.
What drags cumulative layout shift
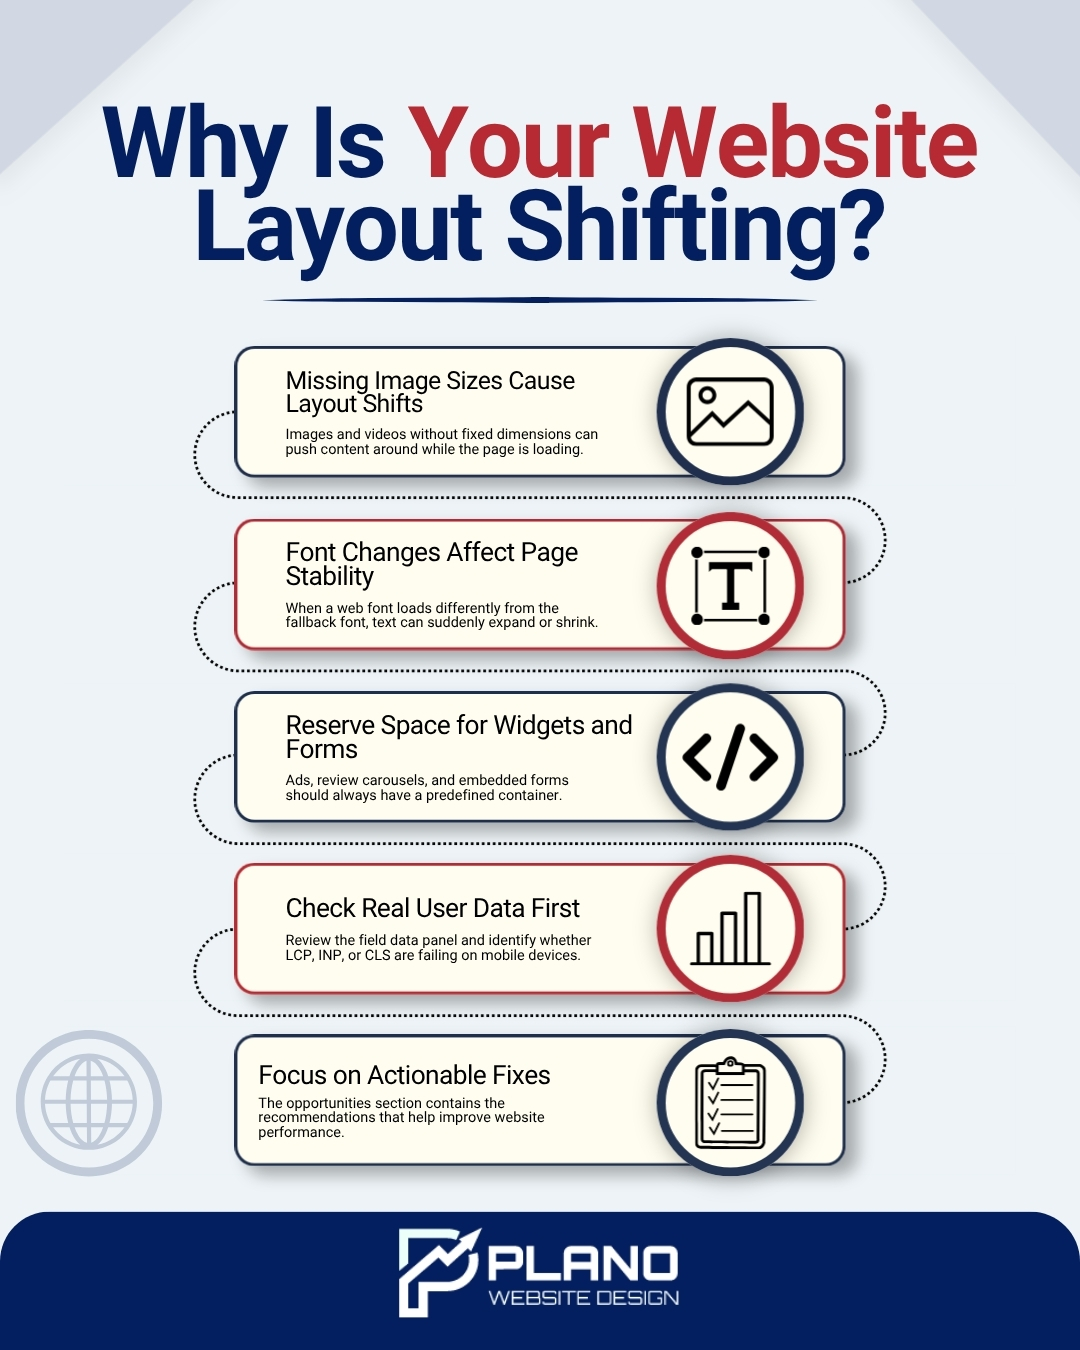
The causes are named directly in Google’s own reference: images or videos with unknown dimensions, fonts that render larger or smaller than the fallback, and third-party ads or widgets that resize themselves. On WordPress, the classic version is a review carousel or a form embed that reserves no space, so the button a reader is reaching for slides down half a second after their thumb commits. Width and height attributes on every image, plus a reserved container for every embed, clear most of it.
Read the Report in This Order
Top panel first, score second. Work down it in this order:
- Field data panel: If it is populated, compare LCP, INP, and CLS against the table above and write down which ones are red on mobile.
- Empty panel: Stop looking for an assessment. There is not one, and the lab section is now your only instrument.
- Lab section last: Read the opportunities list rather than the headline number, because the list is where the actionable detail lives even though the number is not the thing being graded.
A Fix Order That Respects the 28-Day Clock
Sequence matters here more than effort, because the feedback loop is a month long.
Start with LCP on the mobile version of your two highest-traffic pages, usually the homepage and one service page. Compress and correctly size the hero image, serve it in a modern format, and stop lazy-loading the element that is visible the moment somebody arrives. Strip scripts next for INP, which is the fastest measurable win on most sites and needs no design changes at all. CLS comes last, because it is the cheapest thing on the list to fix once you know which element is moving.
Test in the lab after each change so you can confirm the direction immediately.
Then wait. Field data redraws over a rolling 28-day window, so a change made this week is not fully represented in your assessment until roughly mid-September.
Which is exactly why August is the month to do it. Plano ISD’s published 2026-2027 calendar on pisd.edu puts the first day of school on Tuesday, August 11, and the weeks that follow are when household search behaviour across Plano, Frisco, McKinney, and Allen settles back into a routine ahead of Q4. Speed work started now has a full 28 days of field data behind it before the holiday quarter opens. That holds whether you handle it in-house or bring in help with web design Plano businesses can actually measure afterwards, and it is the one part of technical SEO where starting late costs you a month you cannot buy back.
One caution on shortcuts. Caching and speed plugins genuinely help LCP, and they do nothing about a third-party booking widget that blocks the main thread or a carousel that reserves no height. Those are build decisions, which is why page speed turns out to be a WordPress website development problem far more often than a plugin problem.
Speed also feeds work you are already paying for. A landing page that paints in four seconds burns budget on every click a Plano PPC campaign sends to it, and that same page is usually where your local SEO Plano traffic lands after tapping through from the map pack. One slow hero image is quietly taxing three channels at once.
Check Your Field Data Before You Pay to Fix Anything
Open your homepage and one service page on mobile, read the top panel before the score, and note which of the three numbers are red. If the panel is empty, you have a traffic problem sitting alongside the speed problem, and the lab score becomes your only guide until that changes. The first move is the hero image. Second is deleting a script.
Structure and technical health are the same job approached from two directions, which is why we treat page speed, Schema Markup, and how AI answers surface local businesses as one workstream rather than three. If you would rather hand the whole thing over, Plano Website Design will run the audit and tell you plainly which of the three numbers is worth your money.